
Google just handed multi-location marketers a new lever, and the timing is not accidental. Local customer optimization is now live inside Performance Max campaigns for store goals, designed to capture buyers at the exact moment they are route-planning, searching for services, or physically traveling near your locations. The pitch is compelling: reach people who are ready to act immediately, not just ready to browse.
But before you reallocate budget, you need to model what this actually does to your unit economics. A feature that prioritizes proximity and immediacy will shift your impression mix, your conversion profile, and possibly your average order value. If you cannot show the CFO how those shifts affect CAC payback and contribution margin, you are not ready to turn it on.
What the Feature Actually Does
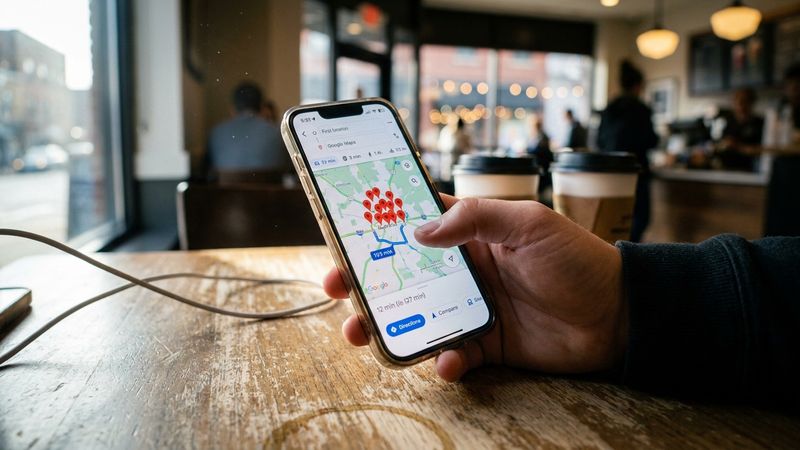
Google's new help documentation describes local customer optimization as a way to prioritize potential customers who are close to or interested in your business area and ready to take action immediately. The surfaces are specific: Google Maps, Waze, and local formats on Google Search. The intent signal is navigation or trip-planning behavior, not just keyword matching.
This is the successor to Local Service Ads, which Google is migrating into the main Ads platform. If you ran LSA campaigns before, you already know the conversion profile: high intent, short consideration window, often lower ticket size. The new feature brings that profile into Performance Max, which means it will compete for budget against your broader PMax goals.
Two constraints matter for planning. First, local customer optimization is not compatible with online campaign goals. You cannot blend e-commerce conversions with store visits in the same campaign and expect this feature to work. Second, it does not play with Merchant Center product feeds. If your PMax strategy relies on shopping inventory, you will need a separate campaign structure for local optimization.
The Math You Need to Run First
The promise of capturing ready-to-act customers sounds like a CAC improvement story. It might be. But the math depends on three variables that Google's documentation does not address: your average transaction value for walk-in versus online customers, your store-level margin structure, and your current attribution model's ability to connect ad exposure to in-store revenue.
Start with transaction value. If your walk-in customers spend 30% less than your online buyers, a shift toward local optimization could lower blended revenue per conversion even as conversion volume rises. That is not a bad outcome if the margin profile is better, but you need to know the numbers before you celebrate the lift.
Next, margin structure. Store visits carry labor costs, real estate costs, and inventory carrying costs that do not appear in your digital CAC calculation. If your CFO is measuring marketing efficiency against gross margin, you need to model the fully loaded cost of a store visit conversion, not just the ad spend.
Finally, attribution. Google offers store visit conversions as a measurement layer, but the methodology relies on location history from opted-in users and statistical modeling to extrapolate. The confidence interval is wide. If you are running a pilot, build in a holdout market or a time-series comparison so you can validate Google's reported conversions against actual foot traffic and POS data.
Structuring the Pilot
A two-week pilot with a single campaign is not going to give you board-grade data. Here is a structure that will.
Select three to five markets with comparable store density, foot traffic baselines, and historical PMax performance. Run local customer optimization in half of them; keep the other half on your current PMax configuration. Match budgets as closely as possible. The goal is to isolate the feature's incremental effect, not to prove that more spend generates more conversions.
Define your primary metric before you launch. If the CFO cares about CAC payback, measure cost per store visit conversion and multiply by your average in-store transaction value. If the CFO cares about contribution margin, you will need POS integration to calculate margin per attributed visit. Do not let the pilot run without a clear success threshold: what lift in efficiency or volume would justify a full rollout?
Set a measurement window that accounts for lag. Store visits often happen 24 to 72 hours after ad exposure. If you are pulling reports daily and making decisions on incomplete data, you will misread the signal. Build in a three-day attribution lag before you evaluate any cohort.
Risks and Mitigations
Three risks deserve explicit attention in your pilot plan.
The first is budget cannibalization. Local customer optimization will pull impressions toward Maps and Waze, which may reduce your presence on YouTube, Display, and Gmail. If your brand awareness goals depend on those surfaces, you could win on store visits while losing on top-of-funnel reach. Monitor impression share by surface throughout the pilot.
The second is audience overlap. If you are already running location-targeted Search campaigns or local extensions, the new feature may compete for the same users. Watch for rising CPCs in your existing local campaigns as a signal that you are bidding against yourself.
The third is measurement contamination. Store visit conversions are modeled, not observed. If your pilot markets have different opt-in rates for location sharing, the reported conversion volumes may not be comparable. Cross-check against POS data or loyalty program check-ins to validate the signal.
What to Show the Board
When you present results, lead with the assumptions. State your average in-store transaction value, your margin per visit, and your attribution methodology. Show the sensitivity table: what happens to CAC payback if transaction value is 10% lower than assumed, or if Google's modeled conversions overstate actual visits by 20%?
Then show the pilot data. Compare cost per store visit conversion in test markets versus control markets. Show the change in impression mix by surface. If you have POS data, show the correlation between reported store visits and actual transactions.
End with a decision framework, not a recommendation. If the pilot shows a 15% improvement in cost per store visit at stable transaction value, what is the rollout plan? If the pilot shows flat efficiency but higher volume, what is the break-even point for incremental budget? Give the CFO the inputs to make the call, not just the conclusion you want them to reach.
The Capability Gap Most Teams Will Miss
Local customer optimization is a targeting feature, not a measurement feature. Google will help you reach people near your stores. Google will not help you prove that those people bought something. The teams that win with this feature will be the ones that close the loop between ad exposure and POS data, either through loyalty programs, CRM matching, or controlled experiments.
If your measurement stack cannot connect the dots, you are flying blind. And flying blind is not a strategy your CFO will fund for long.


