
You walk into the quarterly review with a deck full of green arrows. Click-through rates are up. Quality scores are climbing. Your A/B test on that Meta campaign crushed it. You're feeling good.
Then your CFO looks up from the spreadsheet and asks, "So how much money did we actually make?"
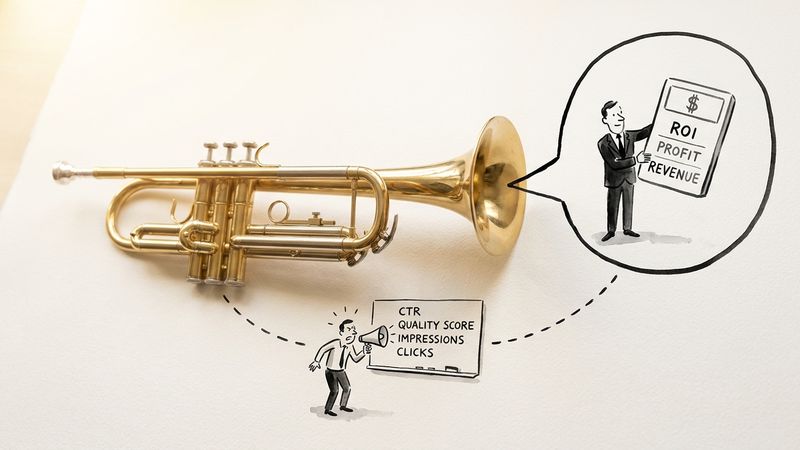
And suddenly, all those beautiful charts feel like you brought a kazoo to a symphony.
Here's the thing: we marketers have been speaking our own language for so long that we forgot the finance team doesn't have a Rosetta Stone. Impressions, CTR, even ROAS in some contexts, these are insider baseball stats. Your CFO isn't tracking batting averages. They're tracking whether the team made the playoffs and how much the tickets cost to get there.
The Language Gap Is a Process Problem
I've sat in enough boardrooms to know this tension isn't personal. Marketing and finance aren't natural enemies. We're just speaking different dialects of the same business language.
As one analysis put it, "The clash between marketing and finance isn't about strategy; it's about language. Dashboards filled with impressions, clicks, and open rates mean little when finance leaders are looking for clarity on revenue, margin, cash flow, and business value."
That's the crux of it. Your CFO wakes up thinking about cash flow, margin protection, and capital efficiency. You wake up thinking about campaign performance and audience targeting. Neither of you is wrong. You're just measuring different parts of the same elephant.
The fix isn't to dumb down your reporting. It's to translate it.
Profit on Ad Spend: The Metric That Changes Everything
Let me introduce you to your new best friend: POAS, or Profit on Ad Spend.
ROAS (Return on Ad Spend) has been the gold standard for years, but here's its dirty secret: it doesn't account for margin. A campaign generating $100,000 in revenue sounds fantastic until you realize the product has a 10% margin and you spent $50,000 to get there. Congratulations, you lost money while your dashboard showed a 2:1 return.
POAS fixes this by incorporating gross margin into the equation. The formula is straightforward: (Revenue × Gross Margin %) ÷ Ad Spend.
Here's where it gets interesting. Campaign A generates $70,000 in revenue with a 20% margin on $10,000 spend. That's 140% POAS. Campaign B generates $40,000 in revenue with a 50% margin on the same spend. That's 200% POAS. Campaign B looks worse on a traditional ROAS dashboard but actually makes more money.
Guess which one your CFO cares about?
CPA Is Only Half the Story
Cost Per Acquisition remains foundational, but the critical question is always "acquisition of what?"
Microconversions like form fills and whitepaper downloads are useful for optimization. They're terrible for executive reporting. When you tell your CFO that CPA dropped 15%, their immediate follow-up should be (and often is): "Cost per what, exactly?"
For B2B companies with long sales cycles, this gets tricky. You can't always report on closed deals in a monthly PPC review because the lag time makes the data meaningless. The solution is to identify the closest proxy to revenue that's still measurable in your reporting window. Marketing Qualified Leads are fine. Sales Qualified Leads are better. Pipeline value is best.
The key is consistency and clarity. Pick your conversion definition, explain it once, and stick with it. Nothing erodes CFO trust faster than shifting goalposts.
The Three Questions Your Report Must Answer
Strip away the complexity, and every CFO is really asking three things:
Are we profitable? Not "are we generating activity" or "are we reaching people." Are the dollars going out coming back with friends?
Is this incremental? Would these sales have happened anyway through organic channels or brand recognition? This is the incrementality question that keeps sophisticated marketers up at night, and it should.
Can we scale efficiently? If we double the budget, do we double the results? Or do we hit diminishing returns at a certain threshold?
Your reporting should answer all three. If it doesn't, you're giving your CFO a weather report when they asked for a flight plan.
Building the Report They'll Actually Read
One CMO put it bluntly: "Drop the BS from your dashboard. Whittle down to things that those in operations and those who run P&Ls understand."
Here's my framework for CFO-ready PPC reporting:
Lead with business outcomes. Revenue influenced, pipeline generated, customer acquisition cost relative to lifetime value. These go on page one, above the fold.
Show trend lines, not snapshots. Week-over-week numbers are noisy. Seasonality, market conditions, even weather can swing results. Show the trend over 90 days minimum. Are we bending the curve in the right direction?
Connect to shared goals. If the company set a target to grow revenue 15% this year, show how PPC is contributing to that specific number. "Meta drove 23% of new customer acquisition this quarter, contributing $X toward our annual growth target" lands differently than "Meta conversions increased 10%."
Include one insight, not twenty. Your CFO doesn't want a data dump. They want to know the single most important thing that happened, why it matters, and what you're doing about it.
The Trust Ladder
Here's something they don't teach in marketing school: CFO trust is earned incrementally.
Start by proving you can impact real business metrics, not platform metrics. Show that when you said a campaign would generate pipeline, it actually did. Do this consistently for two or three quarters.
Once you've established that credibility, you earn the right to talk about brand investment, awareness campaigns, and longer-term plays that don't have immediate ROI. But you have to climb the ladder. You can't start at the top.
The marketers who complain that "finance doesn't understand brand building" often haven't done the work to prove they understand finance first.
Stop Reporting to Impress, Start Reporting to Align
The best PPC report I ever saw was three pages. Page one: revenue impact and cost efficiency versus target. Page two: what's working and what we're scaling. Page three: what's not working and what we're cutting.
No vanity metrics. No impressive-sounding acronyms. No charts designed to obscure rather than illuminate.
The CFO read it in four minutes, asked two questions, and approved a budget increase on the spot.
That's the goal. Not to dazzle with data, but to align on outcomes. Your CFO isn't the enemy of creative marketing. They're the person who can unlock more budget when you prove the investment is working.
Speak their language, and they'll fund your campaigns. Keep speaking only yours, and you'll keep wondering why the budget conversation feels like a hostage negotiation.


