
Google quietly shipped the most significant Search Console update in years, and most marketing teams are still looking at blended data that masks what's actually happening to their organic traffic. Since June 2026, Google's new Search Generative AI performance reports have separated AI Overview and AI Mode impressions from traditional web search. If you're still running pipeline reviews with aggregate organic numbers, you're flying blind into a channel that now touches 58% of queries.
The CFO question is straightforward: how much of our organic traffic is coming from AI-generated results, and what's the conversion quality of that traffic versus traditional clicks? Until this update, the answer was "we don't know." Now we have the data infrastructure to find out.
What the New Reports Actually Show
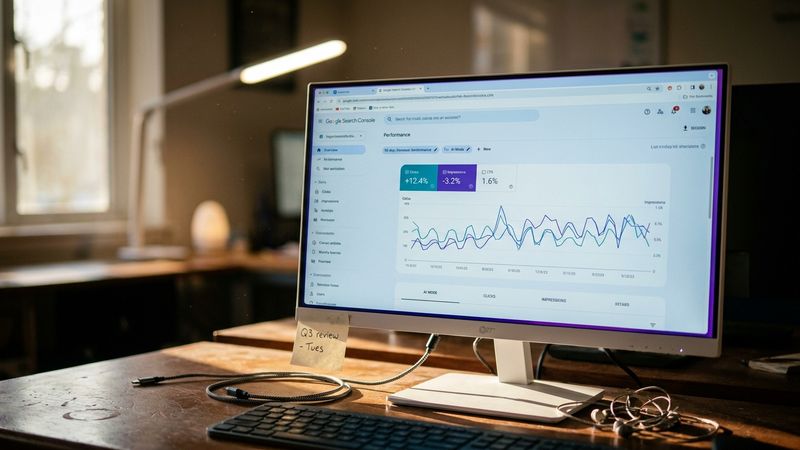
The updated Search Console segments AI traffic into dedicated views rather than folding it into your aggregate web search metrics. According to Digital Applied's analysis, the new Search Type filter includes separate segments for AI Overviews (the summary boxes appearing above traditional results) and AI Mode queries (the conversational, multi-turn search experience Google is expanding).
The reports surface five dimensions: impressions within AI features, which URLs appeared, country-level visibility, device breakdown, and date-range performance with hourly granularity. What they don't yet show is click-through rate at the AI segment level, which means you'll need to triangulate with GA4 to get the full picture.
Here's the operational reality: AI Mode queries run 2.3x longer than traditional searches. They're conversational, research-oriented, and signal high-intent informational behavior. Tracking these separately from transactional web queries tells you which content is driving AI-assisted discovery versus direct navigation. That distinction matters for conversion funnel analysis and content investment decisions.
The CTR Math Your Board Needs to See
The impression-to-click ratio in AI results is fundamentally different from traditional organic. Seer Interactive's study of 25.1 million impressions found that when an AI Overview appears, organic CTR drops from 1.76% to 0.61%, a 61% decline. Ahrefs' December 2025 analysis confirmed the pattern: AI Overviews reduce position-one CTR by 58%.
This creates a measurement problem. Your impressions inside AI Overviews will look enormous compared to clicks. If you report these numbers without context, you'll either panic your leadership team or create unrealistic expectations about "AI visibility" that never converts.
The more meaningful metrics are citation frequency (how often your URLs appear as sources in AI responses) and impression share within your target query set. A page that gets cited in 40% of AI Overviews for a high-value keyword cluster is doing real work, even if the direct click volume looks modest.
The flip side is equally important for your business case: brands cited inside AI Overviews earn 35% more organic clicks than those that don't appear. Citation is becoming a prerequisite for maintaining organic traffic, not a bonus.
Building the Reports That Actually Matter
Default Search Console views blend all search types, which masks AI traffic trends entirely. You need dedicated saved views filtered to AI Overviews and AI Mode, segmented by query, page, and date range. This is your baseline for understanding how the AI search transition is affecting your specific site.
Start with three filtered reports:
AI Overview Performance by Page
Filter Search Type to AI Overviews, then segment by page. This shows which URLs are earning citations. Cross-reference with your content investment data to calculate cost-per-citation and identify which content formats are working.
AI Mode Query Analysis
Filter to AI Mode, segment by query. These longer, conversational queries reveal what questions your audience is asking when they're in research mode. Map these to your funnel stages and content gaps.
Week-over-Week Comparison
Same filters, but compare the current period to the previous period. AI Overview prevalence has grown from 31% to 48% of queries in the past year. Your site-level trends should track against that baseline.
According to DM Cockpit's documentation, AI Mode data now includes clicks from links embedded within AI summaries, impressions when your site is featured, average position in AI results, and follow-up queries from conversational search threads. Build your reports to capture all four.
What This Means for Content Investment
The data suggests a clear reallocation thesis. Content that earns AI citations is structurally different from content optimized for traditional position-one rankings. AI Overviews cite between 3 and 8 sources per response, and 59.8% of those citations are brand websites, significantly higher than ChatGPT or Perplexity, which lean heavily on Wikipedia and Reddit.
This means your owned content has a structural advantage in Google's AI ecosystem that it doesn't have in other LLM-powered search experiences. The investment implication: prioritize content that answers specific questions with citable facts, structured data, and clear attribution. Kill the thin pages that aren't earning citations and reallocate that budget to the formats that are.
No new schema or markup is required to appear in AI Mode. The fundamentals still apply: clear site architecture, quality content, mobile performance. But the measurement layer has changed, and your reporting needs to reflect that.
The Two-Week Pilot
If you're presenting AI search performance to your board or CFO for the first time, here's the minimum viable setup:
Week One
Configure the three filtered reports described above. Pull baseline data for the past 90 days. Identify your top 20 pages by AI Overview impressions and your top 20 queries by AI Mode volume.
Week Two
Cross-reference with GA4 to estimate conversion rates for AI-sourced traffic versus traditional organic. Build a one-page summary showing impression trends, citation frequency for priority keywords, and preliminary conversion data with appropriate confidence intervals.
The risk is that AI traffic converts differently than traditional organic, and you won't know the direction until you measure it. The opportunity is that you now have the data to make that case either way.
Google gave us the instrumentation. The question is whether your team will use it before your competitors do.


